Climate Central

Understanding Coastal Risks

The Situation

Climate Central is a non-partisan organization that uses scientific fact, big data, and cutting-edge technology to bring climate change into view. Its research and tools help millions worldwide to understand and respond to climate threats facing their communities. The Climate Central team came to us with a vision to combine a collection of existing coastal risk tools, analysis, and data visualizations into a single, powerful application. Our greatest challenge was to make the tool and all of its depth accessible to a broad range of stakeholders for maximum exposure and effect—scientists to citizens.

Our Approach

During our four-month engagement, we designed and prototyped a web application that delivers layers of complexity and information to users with varying levels of expertise. This meant streamlining the existing tools and data sets into a guided experience that is intuitive, high-impact, narrative-driven, and visually compelling. Novice users can explore preset projection scenarios by temperature, year, or water level, and dive into educational content to enable them to take action at home and in their communities. Advanced users can control granular settings to generate fine-tuned scenarios, dive deep into the underlying data, and obtain a range of visualization and fact sheets to support their work.

Untuck climate central heading

Guided Experience for All

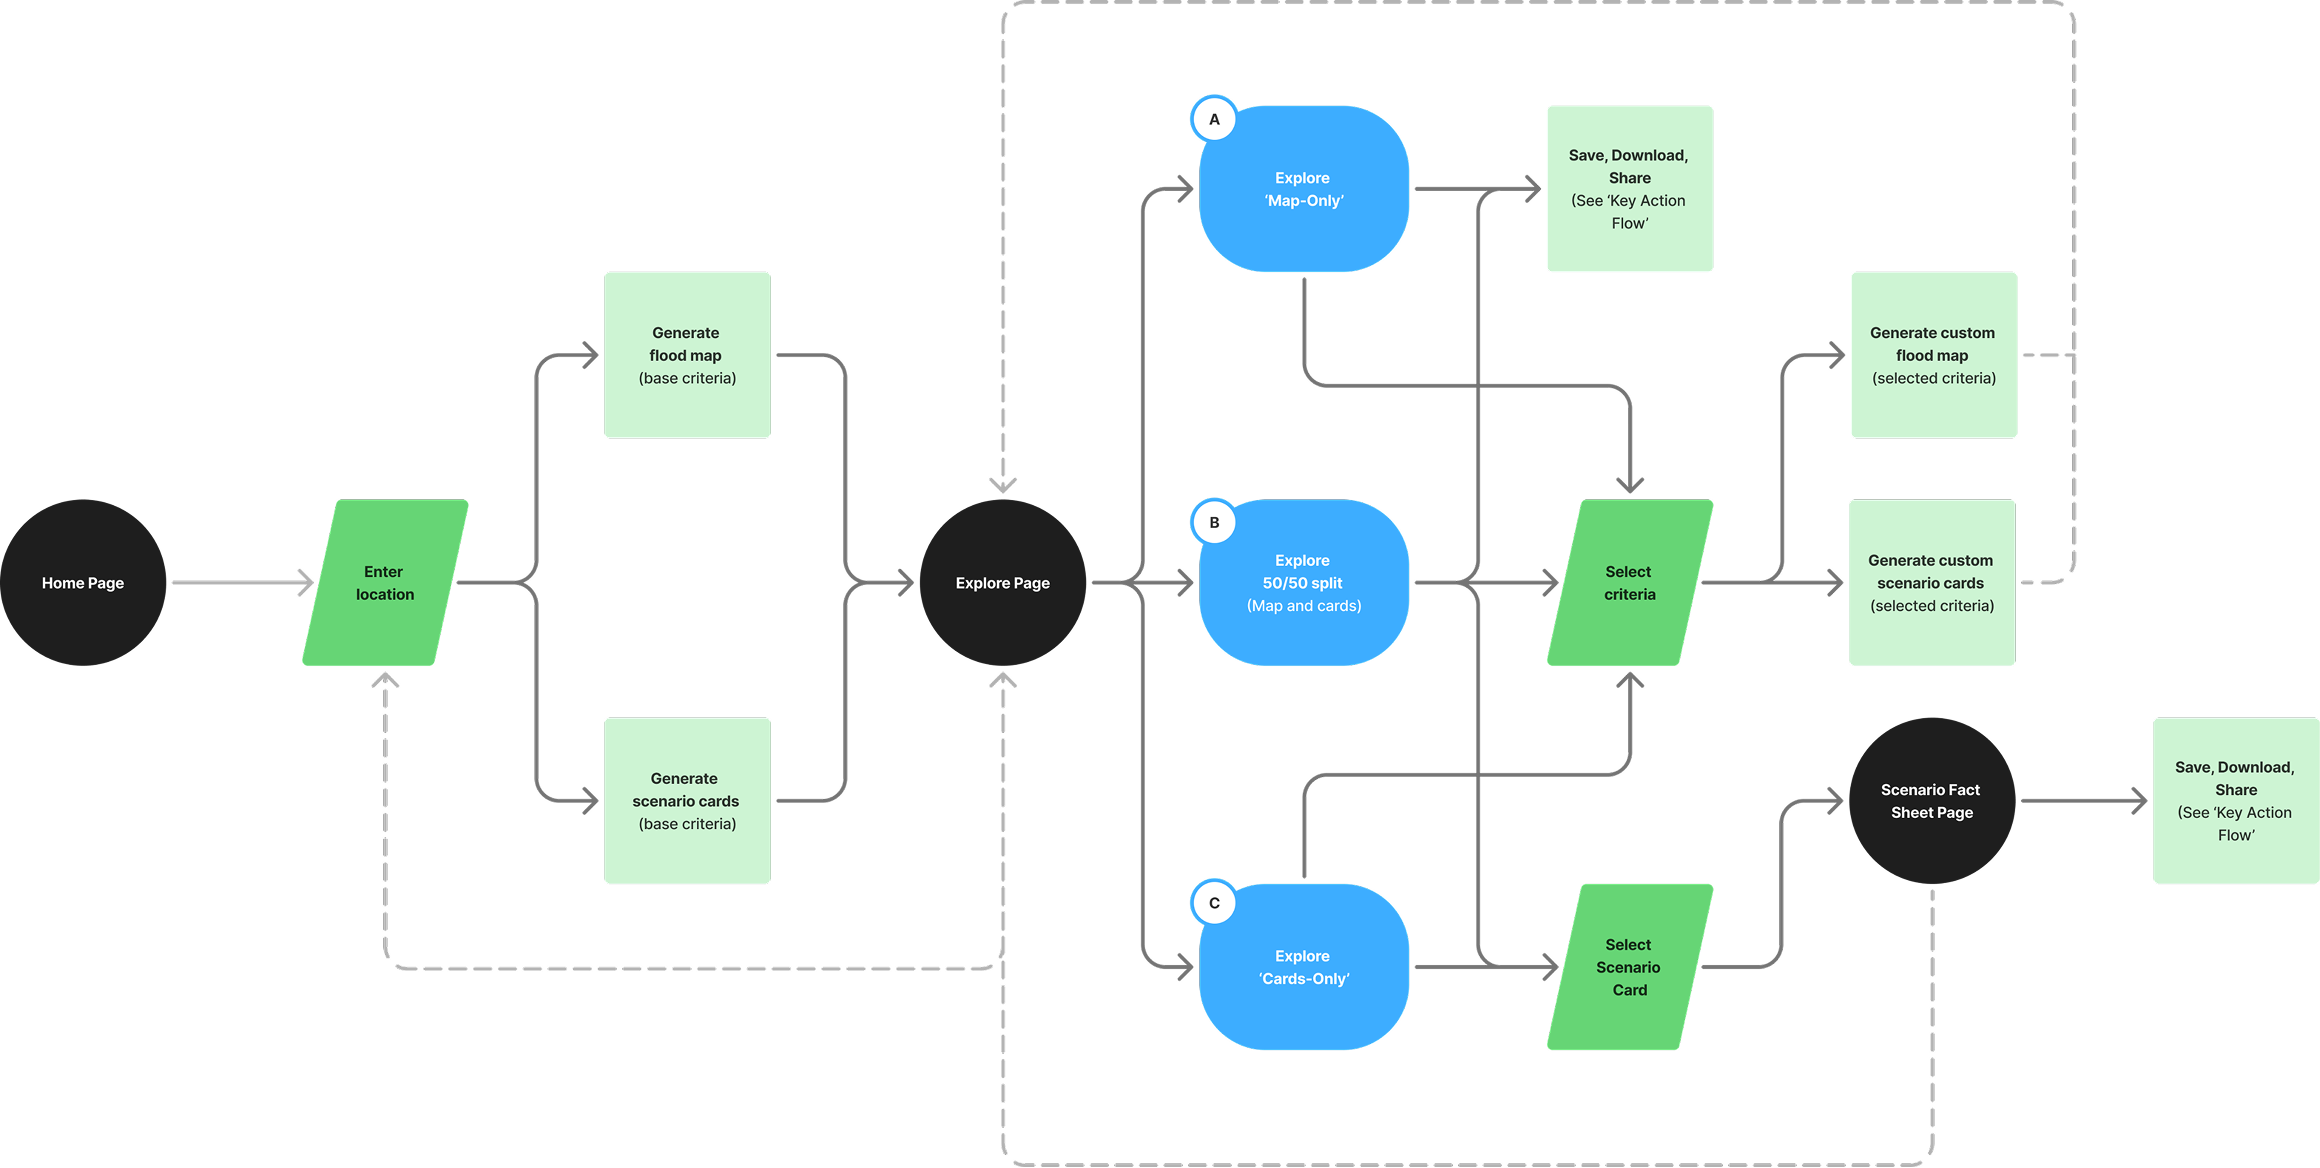
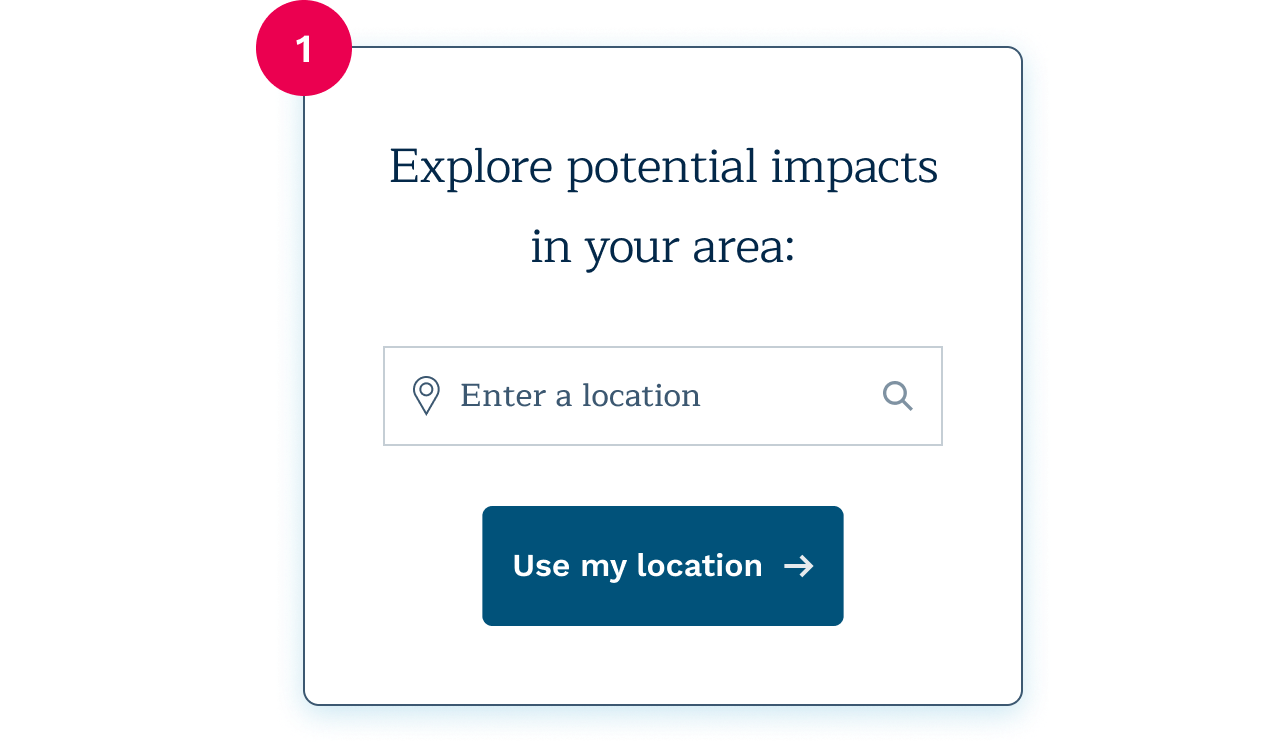
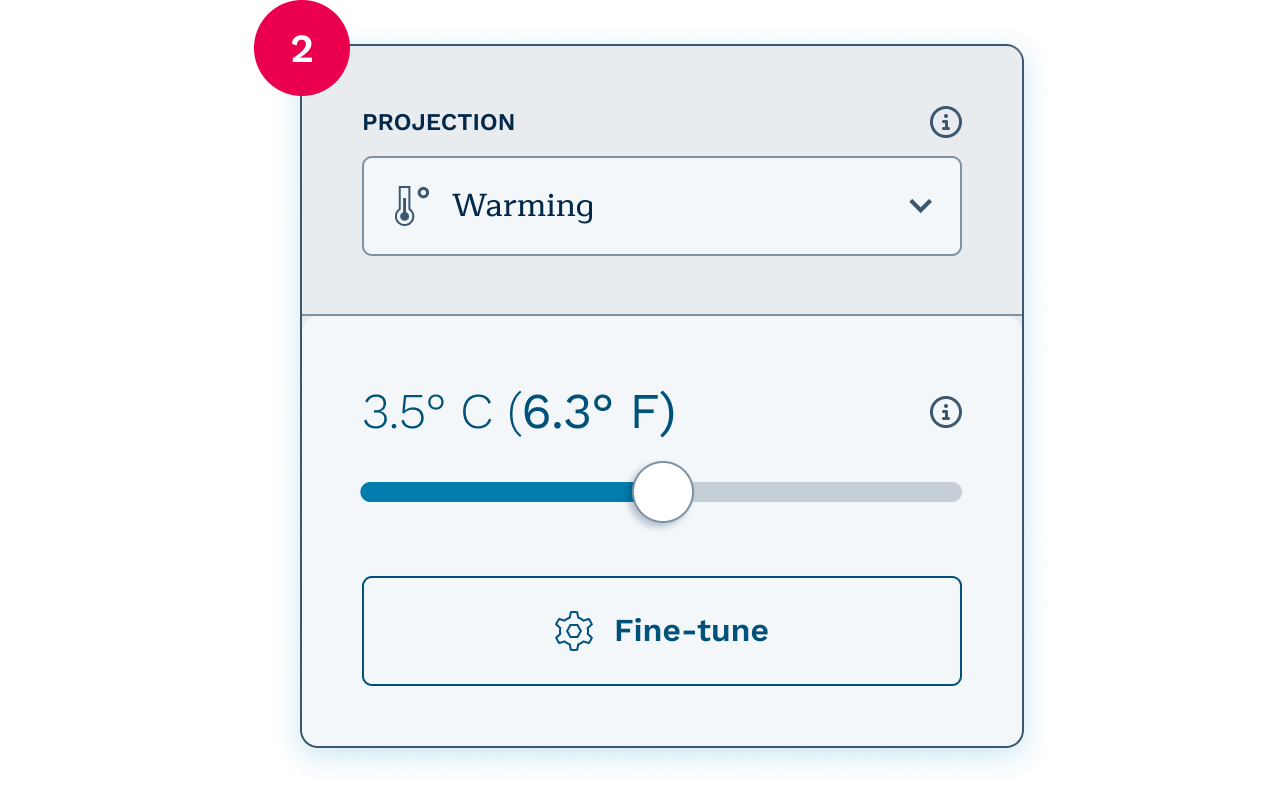
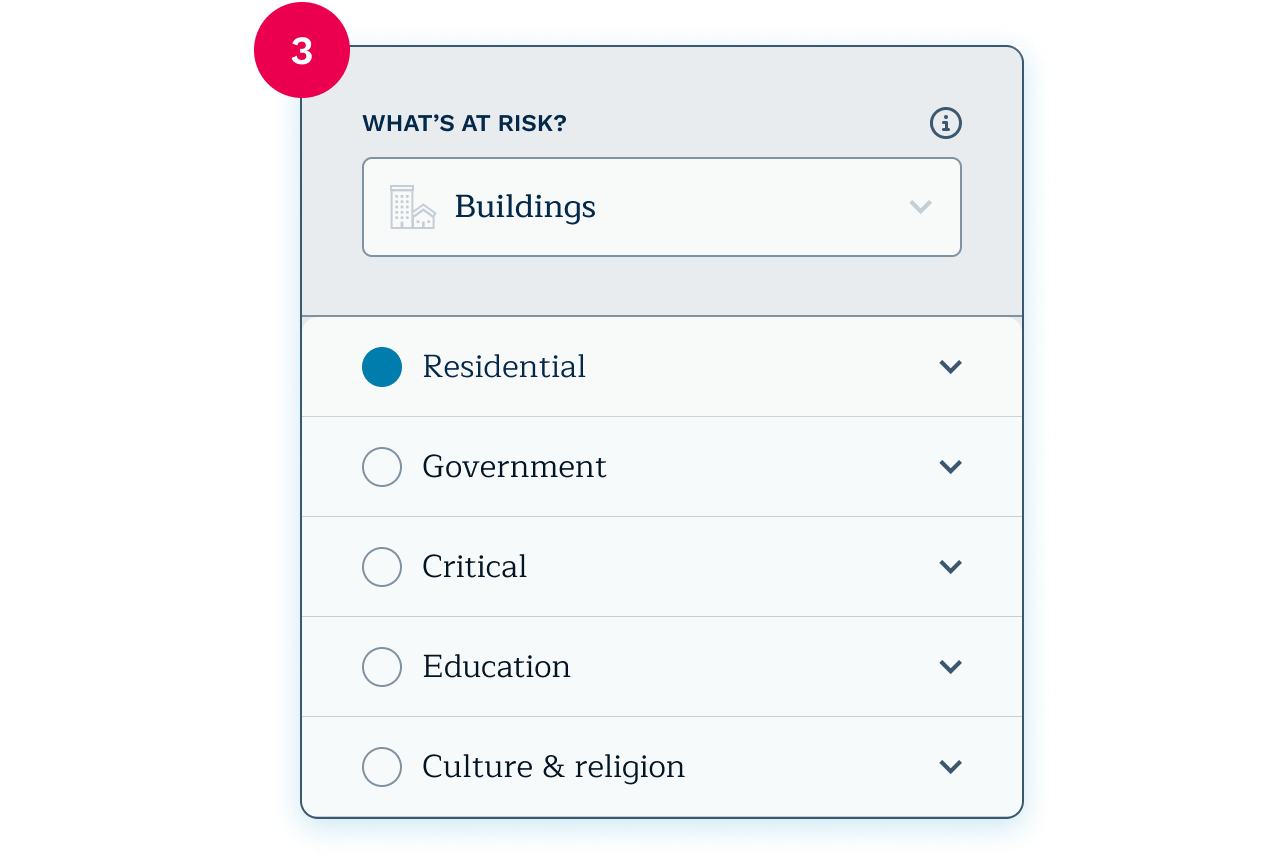
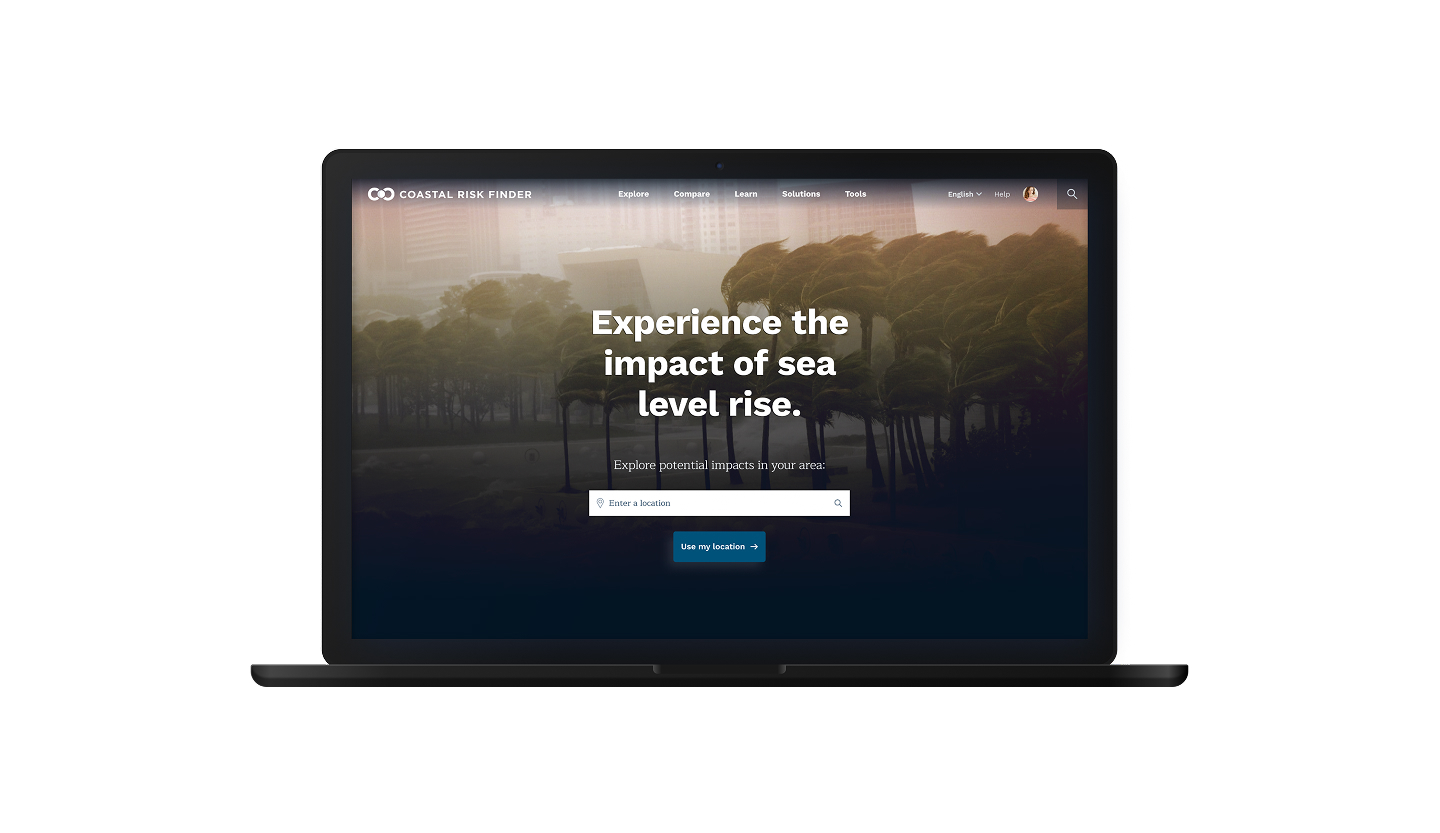
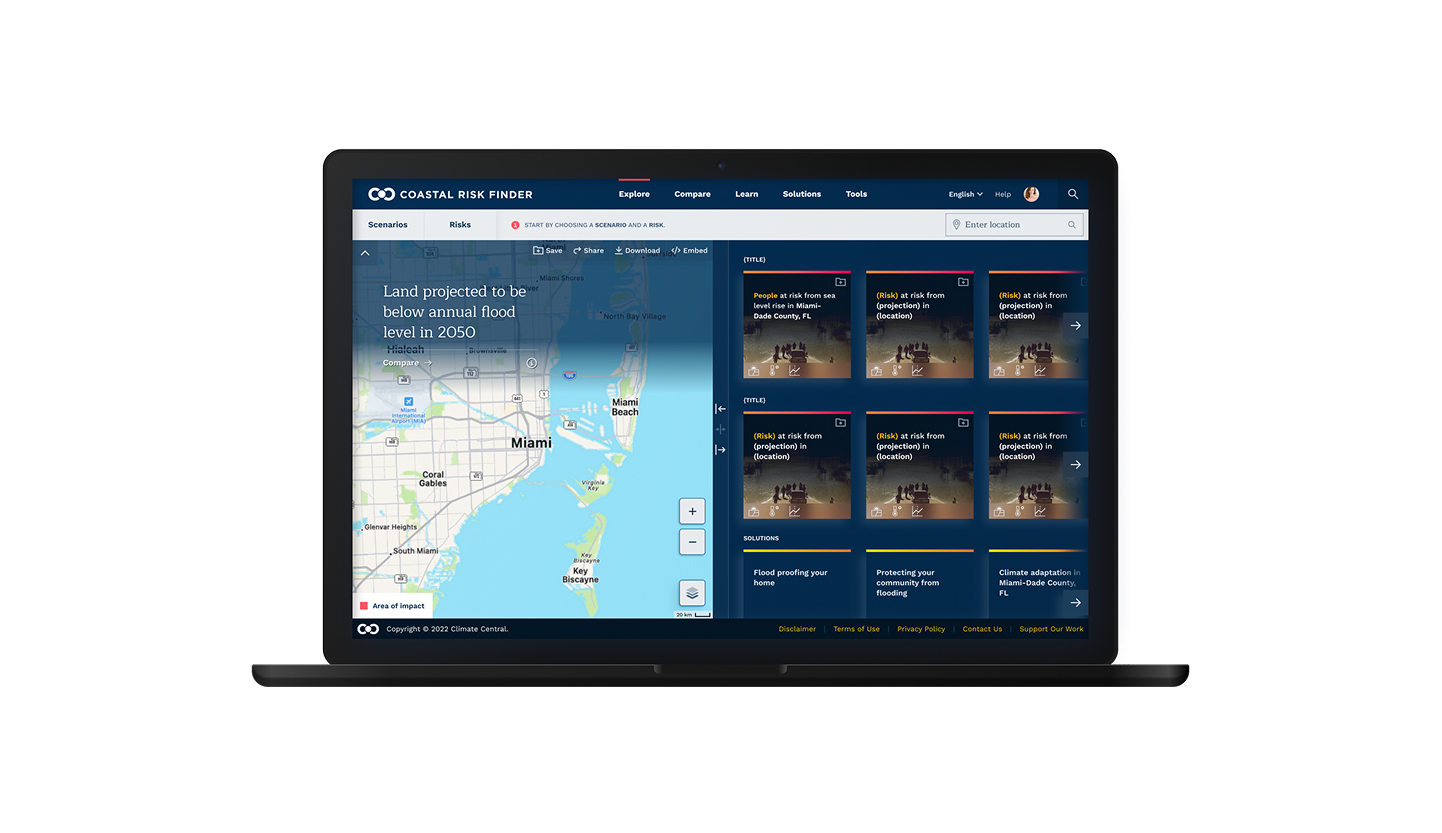
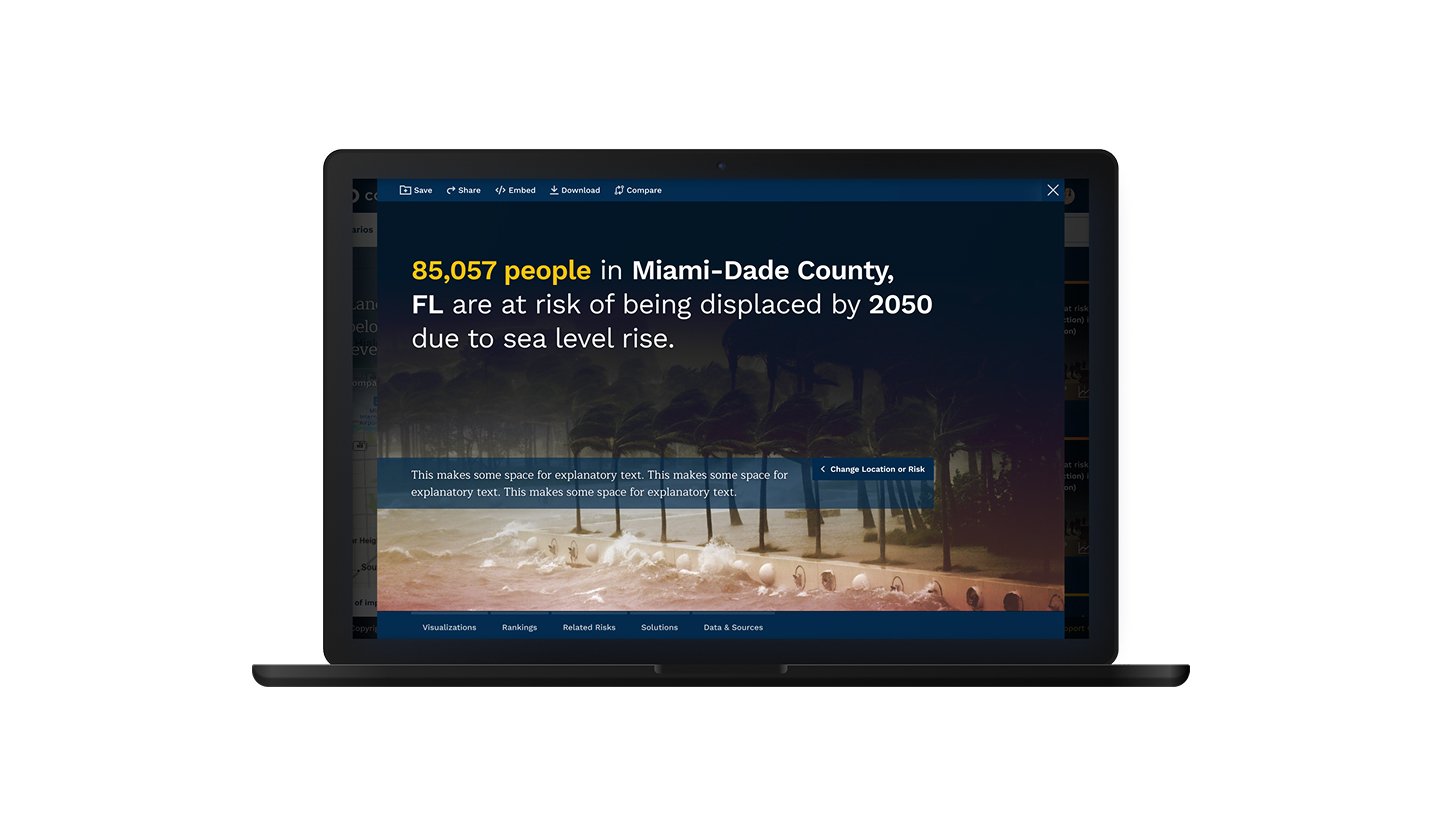
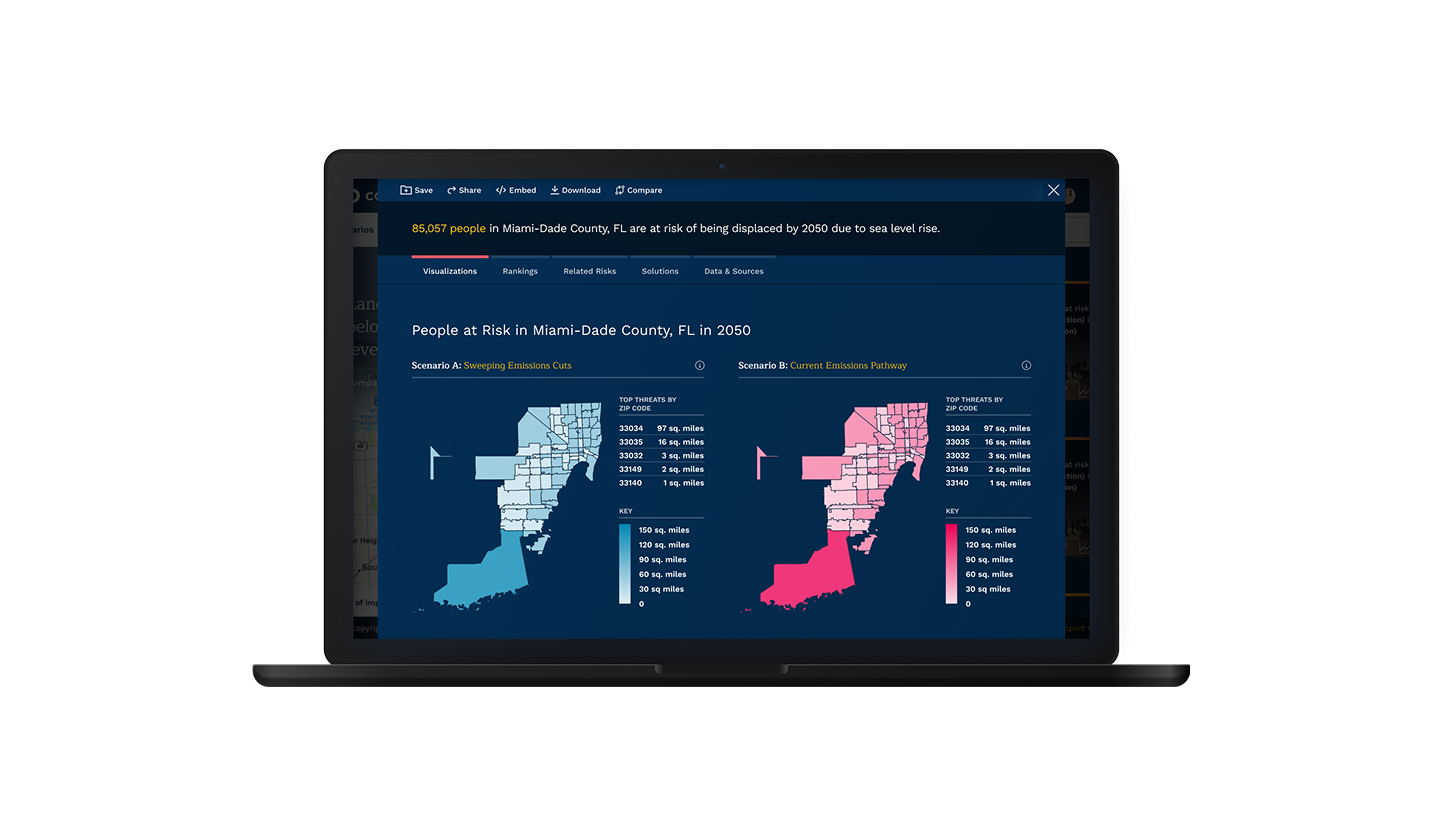
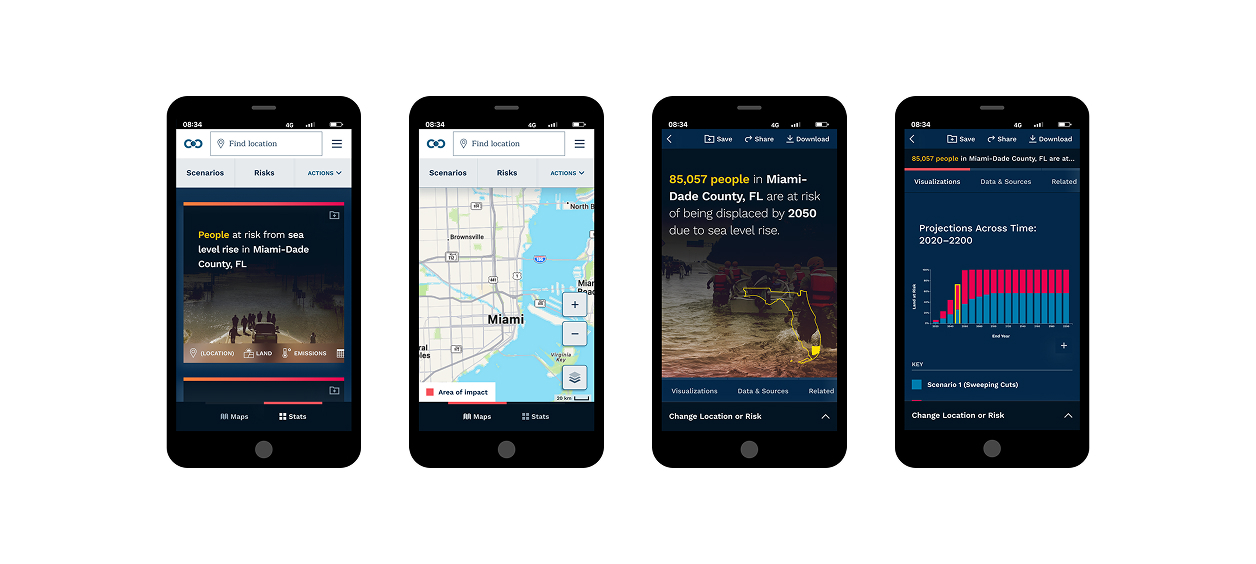
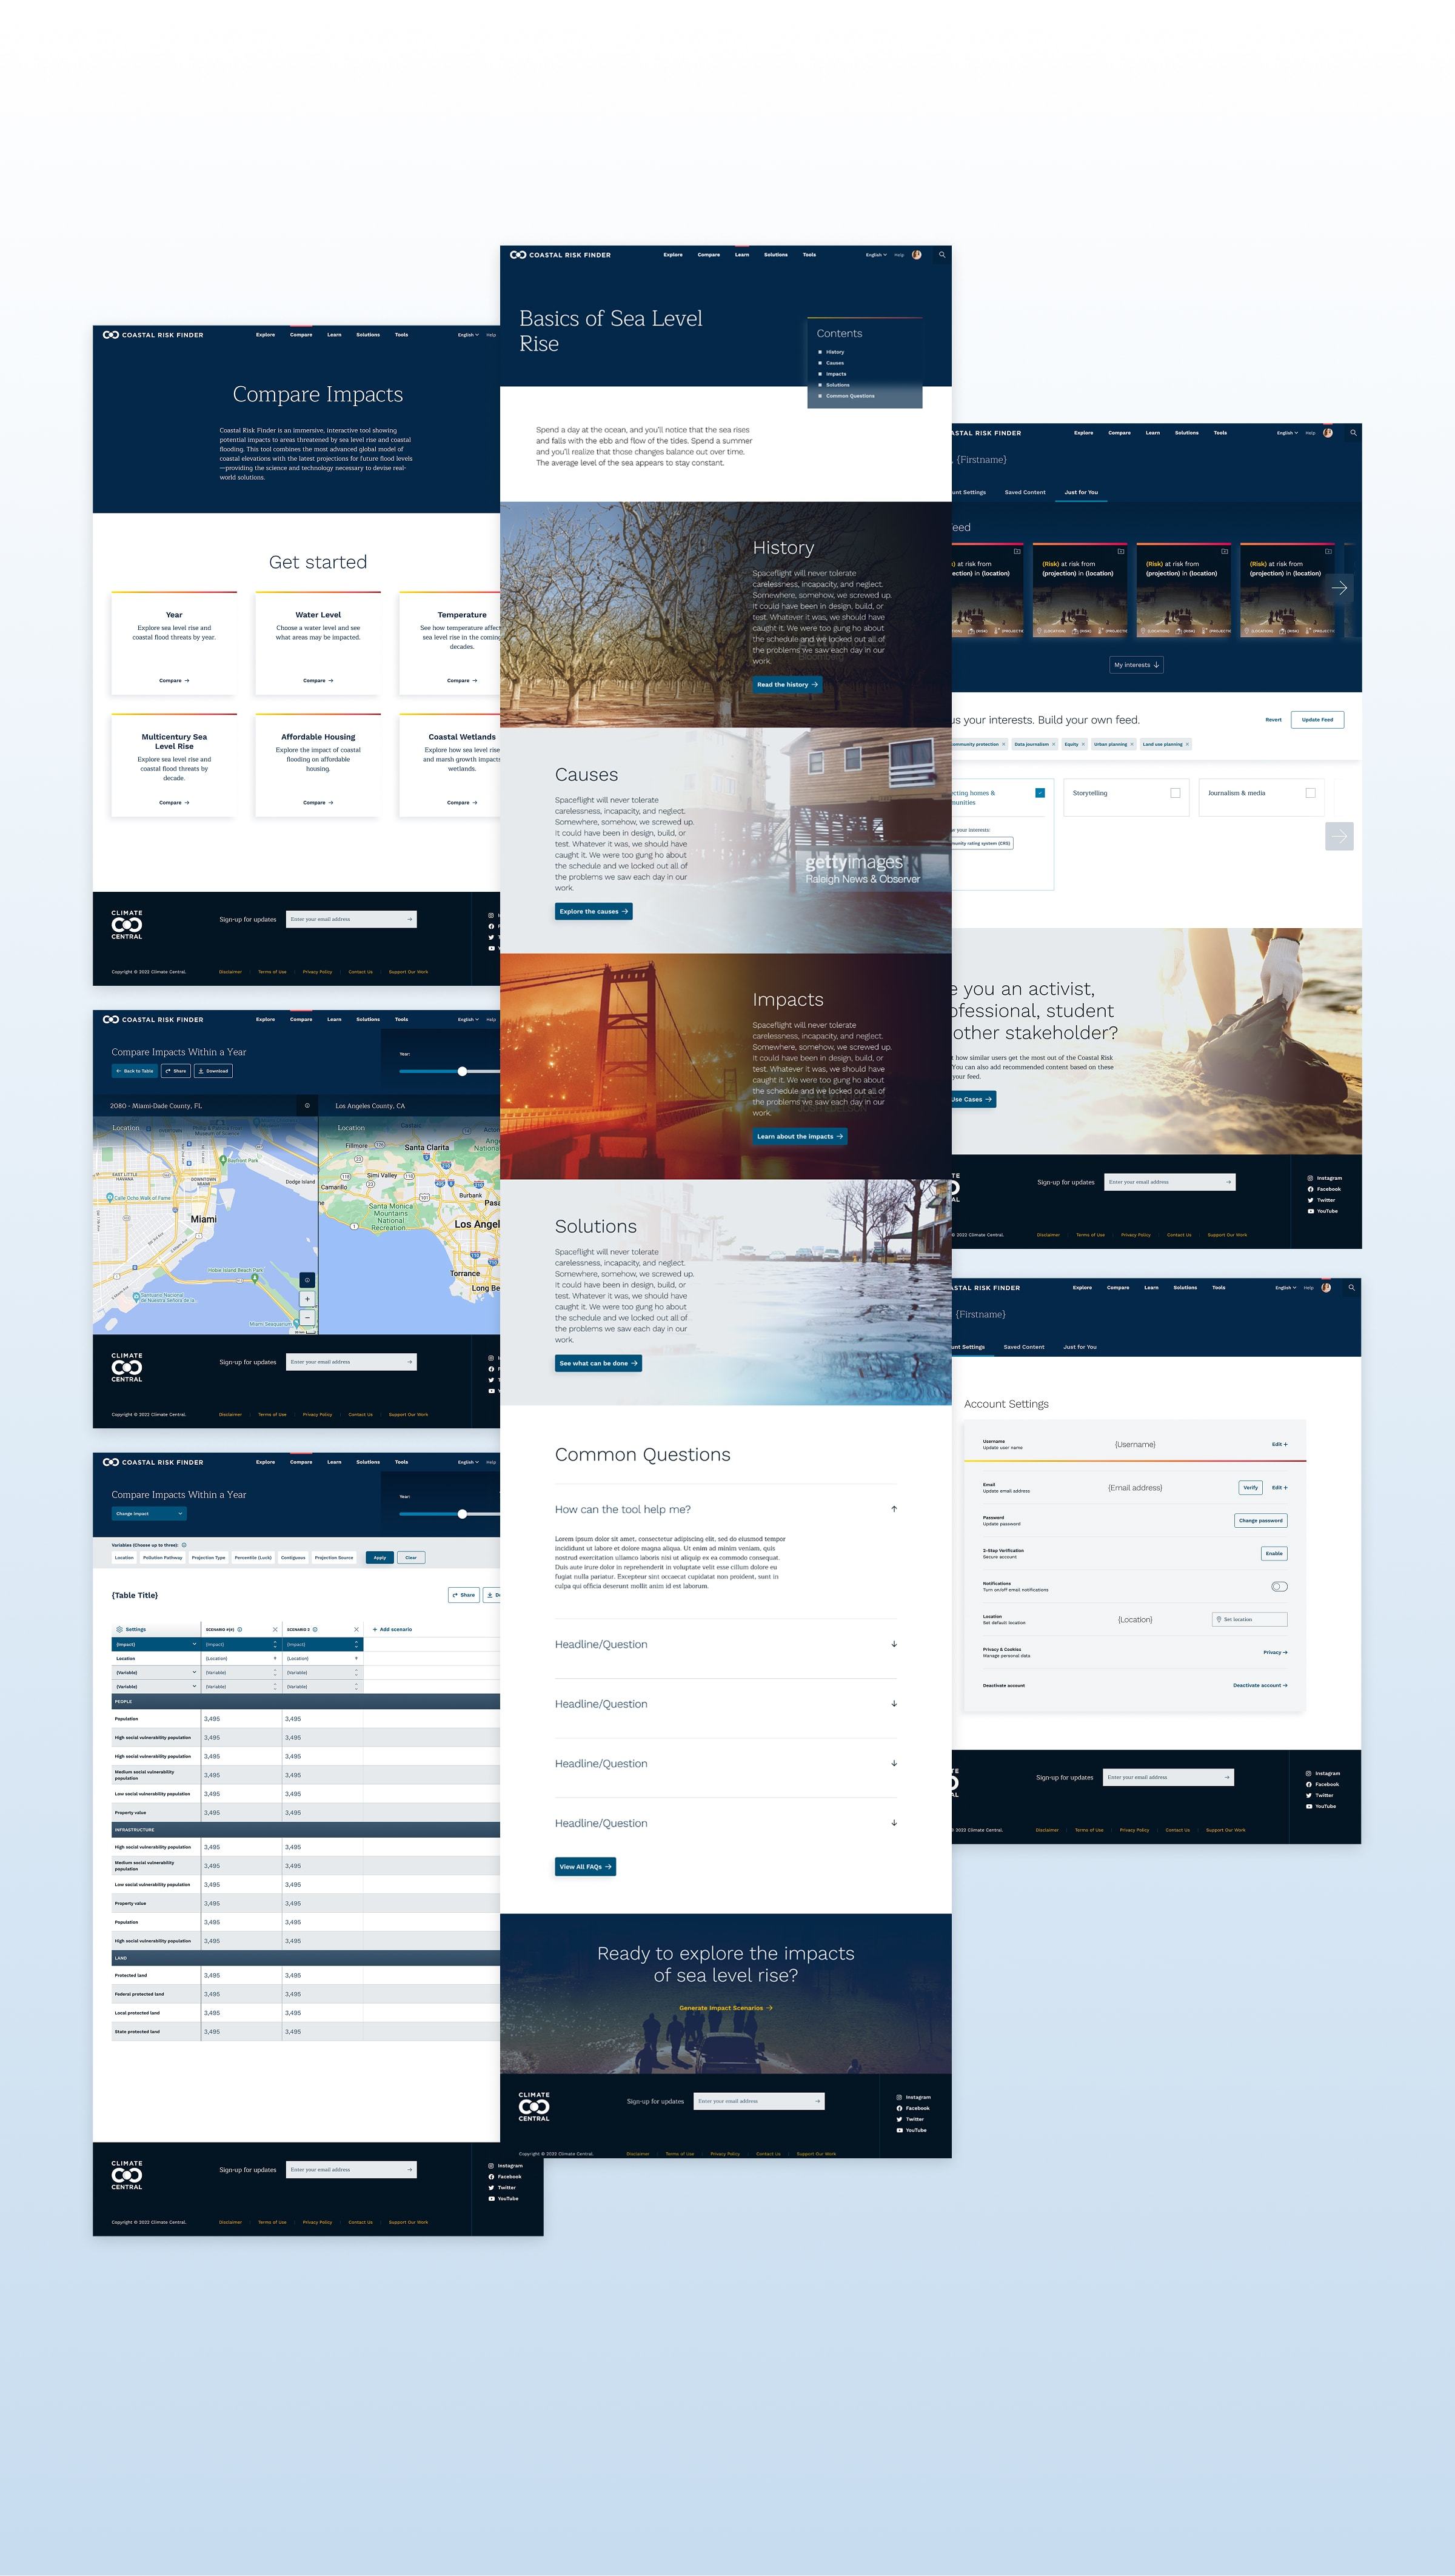
We utilized a hyper-focused approach inspired by online marketplaces like Zillow that start with a simple action—entering a location. This approach naturally guides all users through a familiar pathway with a low barrier for entry. Once the location is entered, visitors are routed to a localized 50/50 split interface to a map which users can explore and customize with preset parameters or to a feed of cards with narrative-driven headlines that can be expanded for a more detailed breakdown of data

Untuck climate central arch
Untuck climate central step 1 alt

Step 1

The homepage encourages users right at the outset to explore local climate impacts by entering a location or using their current one.

Untuck climate central step 2

Step 2

At the map screen, users can define Scenarios based on projections of either temperature, year, or water level.

Untuck climate central step 3

Step 3

Users also define impacts within Risk categories of people, buildings, land, contamination sites, and infrastructure.

Untuck climate central step 4

Step 4

Alongside the map are feeds of cards detailing scenarios and solutions, which users can click to explore the data in depth.

Untuck climate central color 2
Untuck climate central type

UI for Usability

Our visual approach expanded upon Climate Central's core identity of typography and color and translated it into a comprehensive UI library that could potentially flow to all of their websites, tools, and apps. For the coastal tool UI, we created a system of layered panels and surfaces to elegantly display information without interrupting the core tool—maps. From universally understood icons that convey categories and functions, to consistent styling of detailed data visualizations like charts, tables, and multimedia, all design decisions were centered on simplicity.

Untuck climate central icons
Untuck climate central design ui 3

Design with Intent

The Climate Central visual identity exudes professionalism and trust. We leaned into this system while adding a heightened sense of urgency and boldness by incorporating a darker tone and theme, high-impact typography, and dramatic imagery at larger scales within the interactive tools. This was counter-balanced by our choice to distinguish the lighter-themed supporting content areas of the site giving users a clear sense of place and focus.

Untuck climate central carousel screen 1
Untuck climate central carousel screen 2
Untuck climate central carousel screen 3
Untuck climate central carousel screen 4
Untuck climate central mobile

A Trove of Additional Features

The website houses a full suite of complementary tools, features, and content to keep users fully informed and engaged. The Impact Comparison feature allows for data projections from different parameters or locations to be viewed side-by-side, both as maps and as tables. A comprehensive primer helps users understand sea level rise in the context of its history, causes, and solutions. Users with accounts can curate their own card feeds based on their interests. The long-term vision is to continuously introduce new features in response to current data and trends.

Untuck climate central flat pages 2

Other Projects

Untuck piur identity featured image

Penn Institute for Urban Research

Sustainable Urban Futures

Science center macbook featured image

Science Center

Startups Change Lives

Lumena featured image

Lumena Foundation

Investing in Women